


Introduction
Network service monitoring and troubleshooting is fundamental to any Network Operations Center activity. Talk to any NOC engineer and you will discover that they rely on an arsenal of tools and processes to keep networks and the services they deliver under control.
However, the increasing complexity of modern networks and the workloads they are supporting is not making the NOC engineer's life easier. Complex topologies can generate an avalanche of events that require equally complex correlations, while the increasing number of interdependencies between network constituents is taking a toll on incident analysis and resolution times.
As providers of hyperautomation solutions that also cater to the telecoms vertical, we have often relied on the observability and explainability of our workflows to simplify network service troubleshooting. With the advent of Generative AI we realized that this simplification can be pushed much further, by automating the interpretation of workflow executions in relation to an observed event. The NOC engineer can now converse with an assistant and guide it through the resolution process using natural language, reducing the time and effort needed to pinpoint the root cause of network incidents.
We will begin our blog post by looking at the approaches currently employed across many NOCs. Next, we will discuss the Waylay hyperautomation approach and its application to a simplified network service monitoring scenario. From there we will show how network monitoring can be radically streamlined by combining the intrinsic observability of the hyperautomation approach with the synthesis capabilities of Generative AI (GenAI) into a powerful and easy to use assistant.
The classic approach to incident troubleshooting in NOCs
Network incidents can take many forms, ranging from a simple alarm on a network element to a stream of events associated with an end-to-end network service. NOCs commonly rely on an array of tools that monitor both networks and applications, alerting engineers of anomalous behavior or events. The telecom market abounds in such tools, catering to network monitoring and management (like SolarWinds, DataDog, NewRelic or Dynatrace), ticketing (like ServiceNow or Jira) or dashboarding and reporting (like Tableau, Grafana or PowerBI).
These tools help manage a vast array of network elements, cloud services, alarms, metrics, and other values. When issues arise, it becomes crucial to be able to navigate through the complexity of data and alarms across all involved systems, unravel the root cause by putting all the collected information pieces together, and determine the most effective remedy for the identified problem.
Traditionally, the process involves navigating through a multitude of tools and conducting deep dives across multiple levels to pinpoint the root cause of an issue. The classical approach that is often used is examining alarms that come from network elements, and trying to filter and correlate them to the specific service to which they are mapped.
Needless to say, if the NOC team is forced to take a bottom-up approach, looking into multiple systems that expose different levels of abstraction and correlating or filtering out the retrieved details manually, the time required to complete the analysis and point to the root cause of the issue becomes significant. Let's take a look at a possible alternative.
Waylay's top-down approach to network monitoring
Another way to approach the problem is to model the service and the quality of service metrics associated with it, calculate additional KPIs as needed, and raise the alarm in case the service is impacted. Rather than going bottom up, with the risk of either raising too many alarms or obfuscating the problem, we go top down, by modeling the desired service and the required quality of said service, and monitoring them for possible issues.
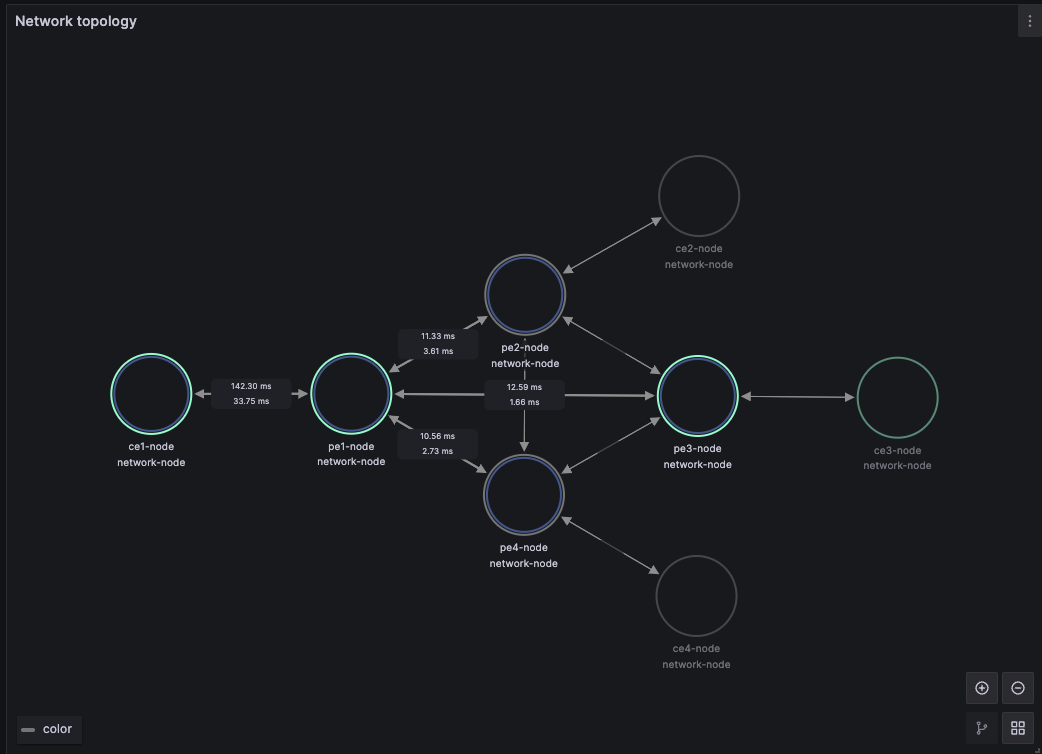
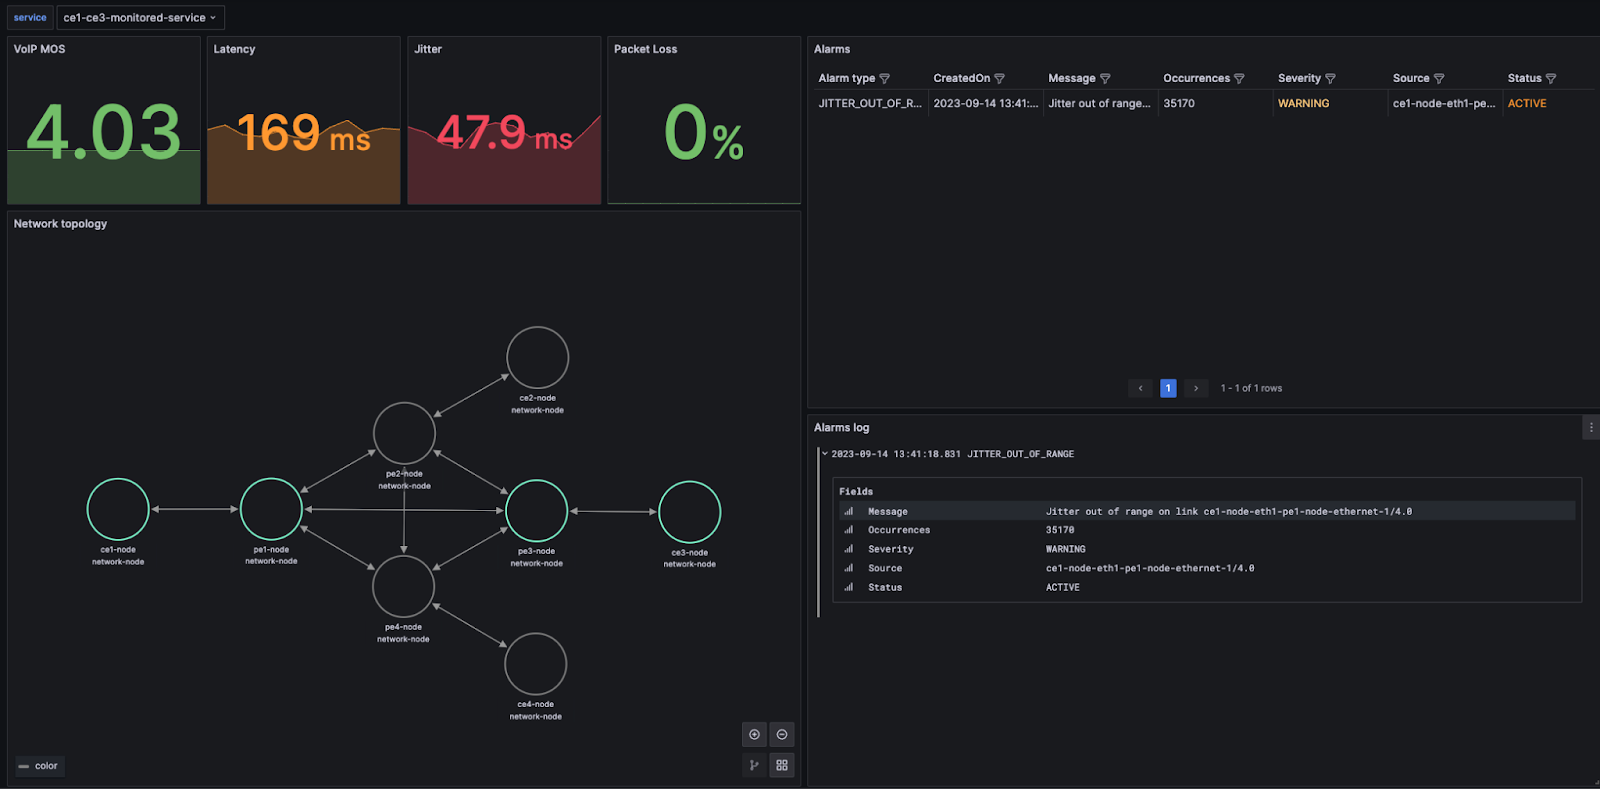
To illustrate this approach, let us consider a simplified scenario where a VoIP service is delivered over a WAN network. Without going into details, the Waylay platform that monitors this network uses an inventory list of provider edge (PE) and customer edge (CE) nodes to discover the network topology automatically, storing it into a NetJSON compatible model that is continuously refreshed via periodic tasks. Via Waylay's GraphQL endpoint, the topology is directly exposed to a dashboarding suite like Grafana, as shown in Figure 2.
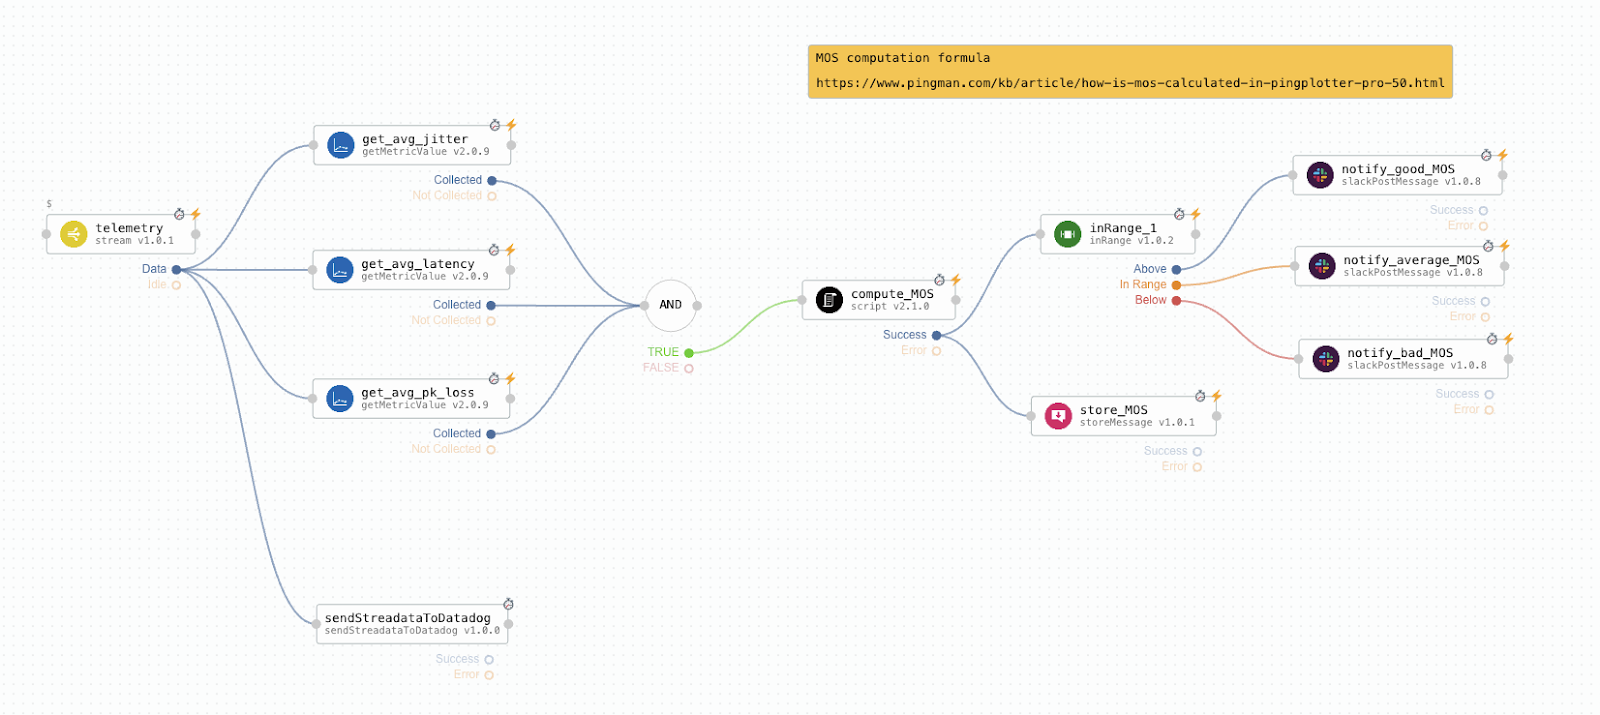
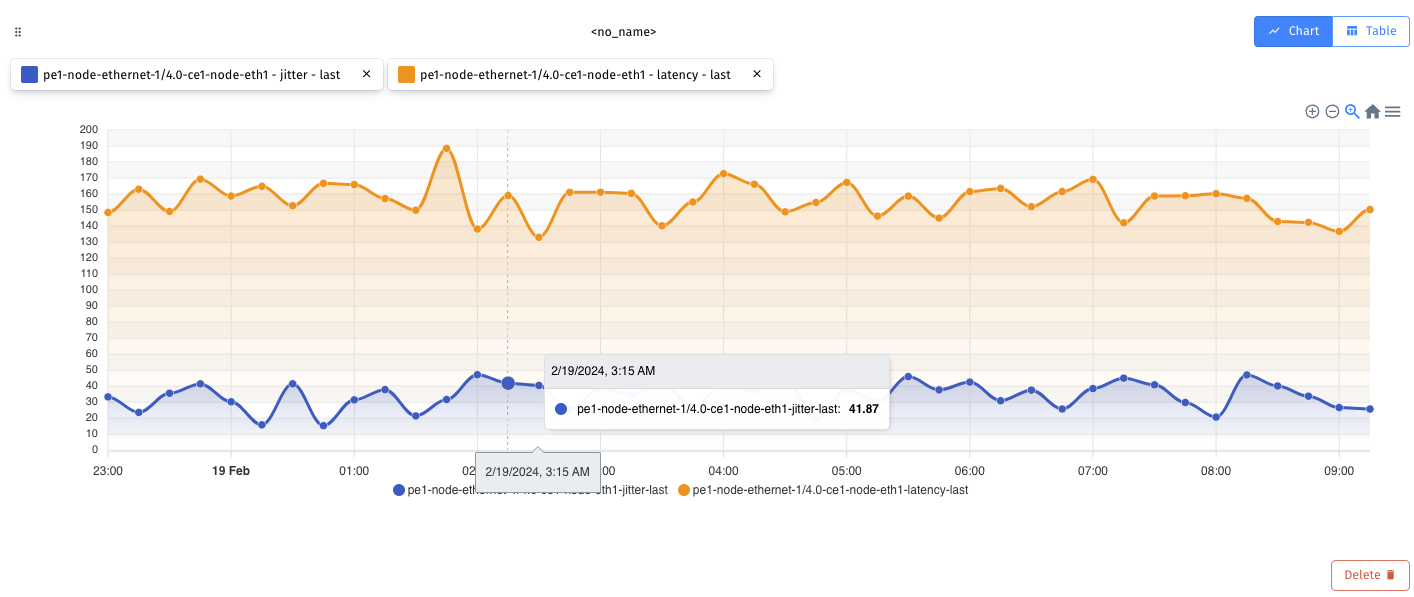
The NOC engineer's job is simple: declare the VoIP service between two CE endpoints. The platform will automatically spawn the necessary monitoring tasks for the new service, which determine the network path between endpoints, collect associated telemetry metrics, calculate service KPIs and trigger alarms when deviations occur from the expected QoS. Figure 3 illustrates the workflow that computes the VoIP MOS KPI, while Figure 4 shows collected metrics at the network link level.
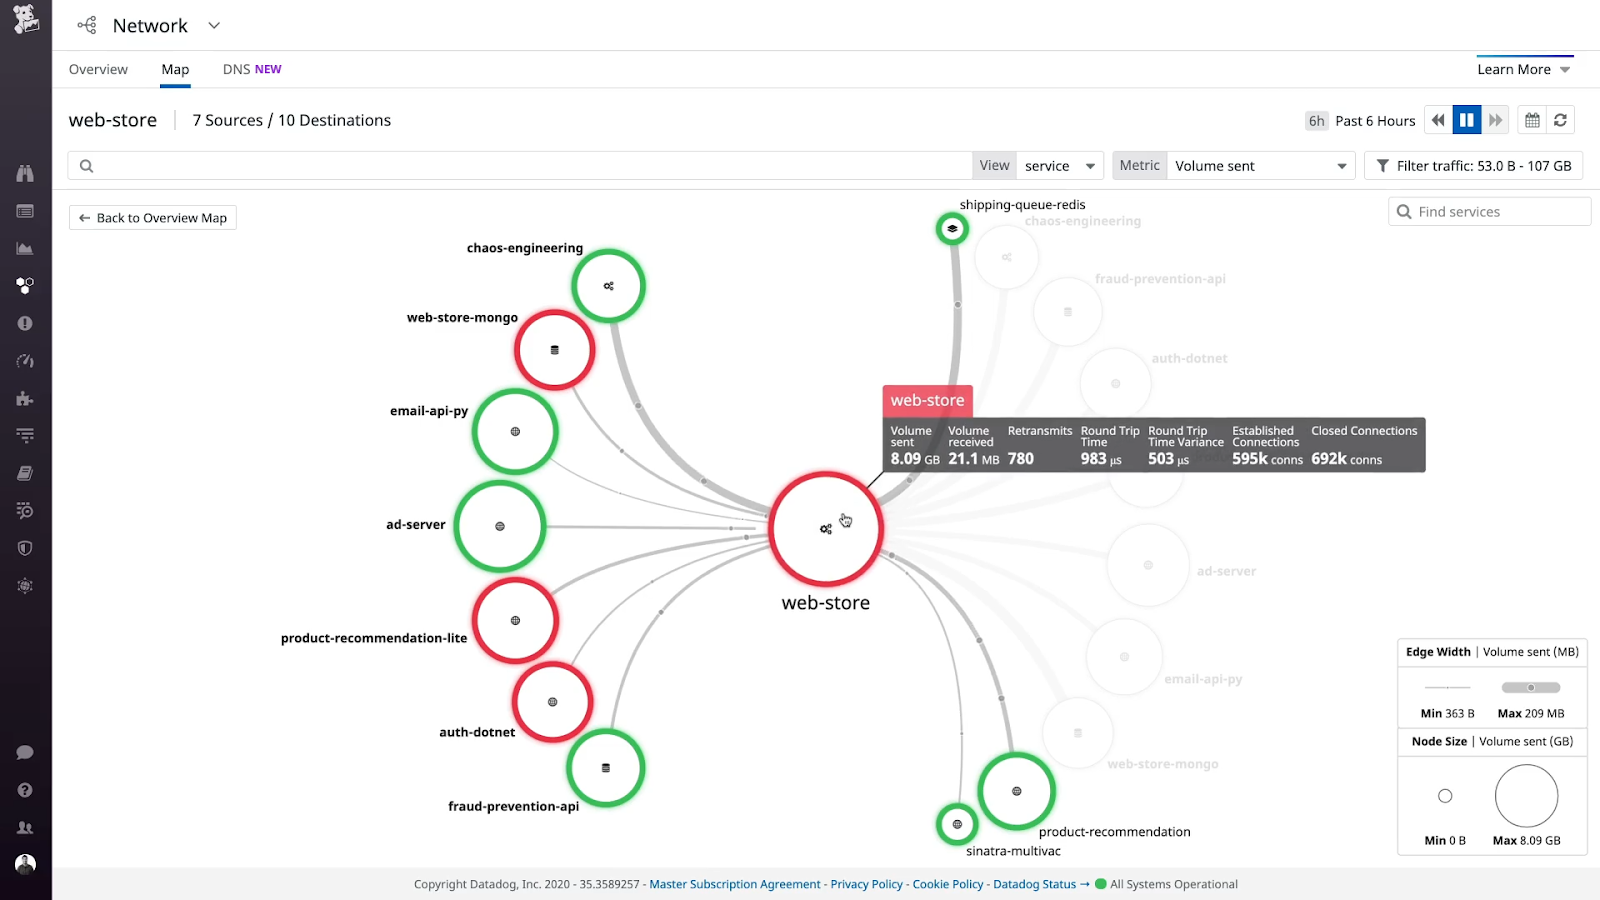
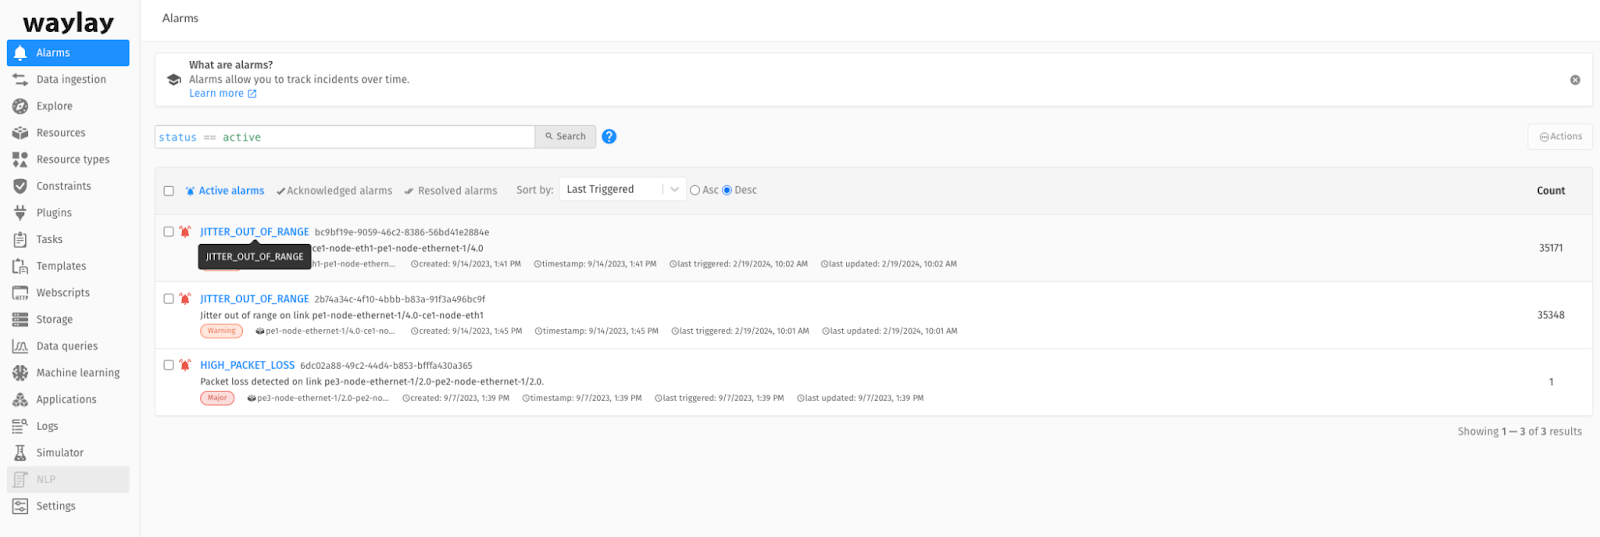
When service monitoring workflows raise an alarm, this alarm is already associated with the network object and the top-level service that caused it, as illustrated in Figure 5. The system will group all alarm occurrences under a single alarm entry, to avoid an avalanche of repetitive alarms (Figure 6).
During root cause analysis, the NOC engineer uses the single pane of glass of the Waylay console to look into the data and NetJSON elements linked to this alarm and determine whether it is triggered by a particular measurement and threshold setting. Subsequent steps involve inspection of the underlying metrics and workflow logs associated with the impacted network entity and service, to determine the cause and the necessary remedy actions.
By this stage we are looking at two simplifications in the root cause analysis process. One is the top-down view of the service and its grouped alarms, with direct links between each alarm and the network entity that caused it. The second is the direct connection between the alarm and the monitoring task that triggered it, which provides the network engineer with immediate access to focused execution logs and telemetry values.
However, our engineer still needs to interpret the task execution and navigate between the different elements of the monitoring platform to determine what happened. Let's look at how we can eliminate this need altogether.
Streamlining troubleshooting by combining Waylay's observable features with Generative AI
GenAI is without doubt the hottest topic in our industry these days. Before we introduce it into the picture, let's first look at the behind-the-scenes Waylay features that provide GenAI with the necessary ingredients for accurate reasoning.
The Waylay rules engine that runs the network monitoring tasks from the previous section is built upon the foundations of a Causal Directed Acyclic Graph (DAG). This structure aligns with the way humans naturally approach automation problems, considering sets of states and conditions to determine subsequent actions. This framework facilitates the description of specific problems or use cases in an intuitive, visual manner. It also comes with intrinsic observability characteristics which allow the user to trace back a workflow execution along the DAG in order to explain why an outcome (like an alarm or automated action) has occurred.
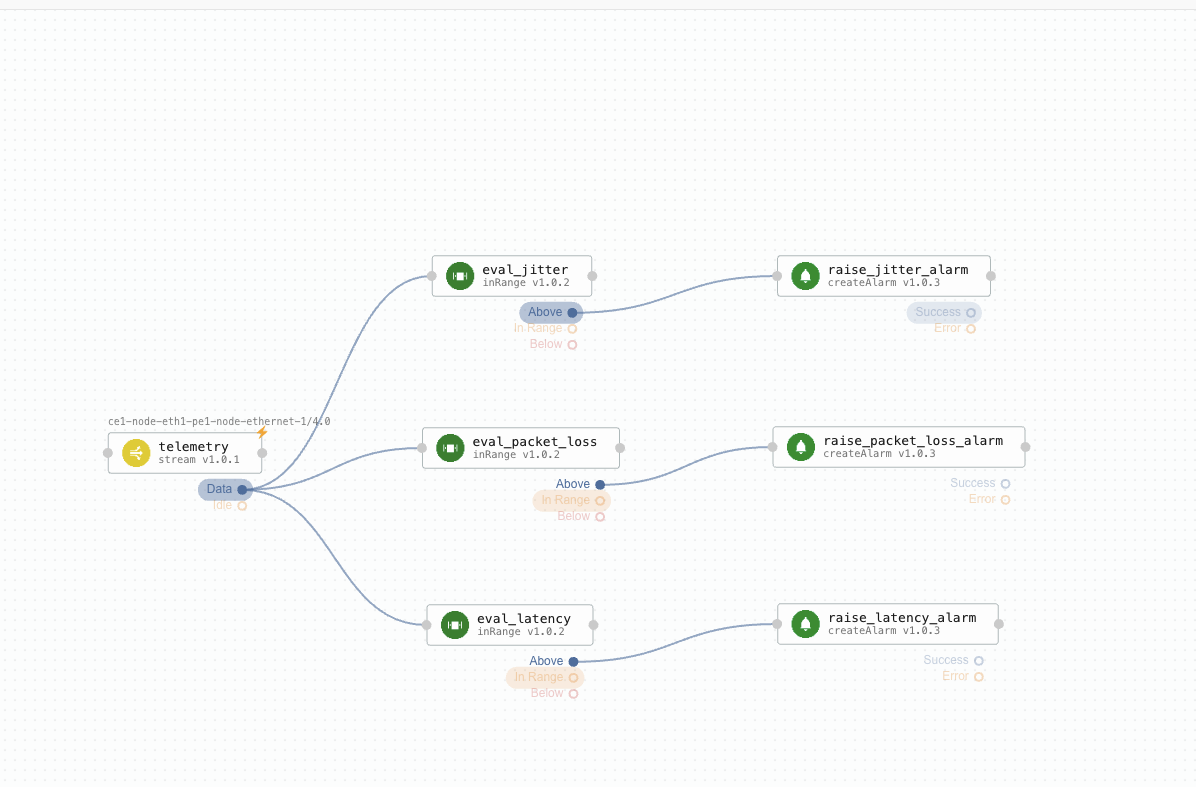
Let us take a look at the task execution that triggered the alarm in the previous section. Taking advantage of the link between alarm and task execution, the NOC engineer is immediately presented with the DAG from Figure 7, where they can observe that the trigger was the evaluation of the jitter metric in the telemetry collected from the network link. Following the activation path in the DAG and correlating it with the task execution logs, the engineer can determine the exact jitter value as well as the out of range condition that led to the activation of the alarm.
It’s no coincidence that the Waylay platform is also capable of exposing task executions in a machine readable format. This facilitates our novel approach to troubleshooting, which incorporates the latest in GenAI with casual modeling. By leveraging large language models (LLMs) we can delegate the task's interpretation to an intelligent assistant that communicates with the NOC engineer through natural language. The assistant would do all the alarm - network entity - task execution correlations in the background, freeing the engineer from the need to navigate these relationships or look at task executions themselves.
As existing models may exhibit a degree of hallucination, their outputs should not be solely relied upon for critical use cases. To address this, we emphasize the importance of fine-tuning these models on carefully curated training sets. These sets delineate causal relations between data and the explanations produced by the model, ensuring robust and reliable answers. Since all Waylay task executions share the same causal model representations regardless of the vertical, the training set can be grounded in our rule representations and use anonymized outcomes. This approach allows us to leverage the resulting model across a diverse range of problems spanning multiple verticals and use cases, even those not explicitly covered in the training set.
Introducing the Waylay Assistant
In real-time scenarios, our assistant connects to the live monitoring environment without a need to be fine tuned on specific customer data. The unique aspect lies in the fact that the descriptions and configurations are derived from the training set models, enabling adaptability to unforeseen challenges and diverse problem landscapes.
Back to our NOC use case, the engineer investigating the most recent network alarms is now equipped with a tool that allows them to guide the investigation using natural language, from a simple chat interface.
Firstly, let's list “all open alarms”. To make things more convenient, the engineer may even employ voice commands because, let's be honest, who wants to type everything manually? Glancing at the interface, the three active alarms from Figure 6 and their summaries are shown.
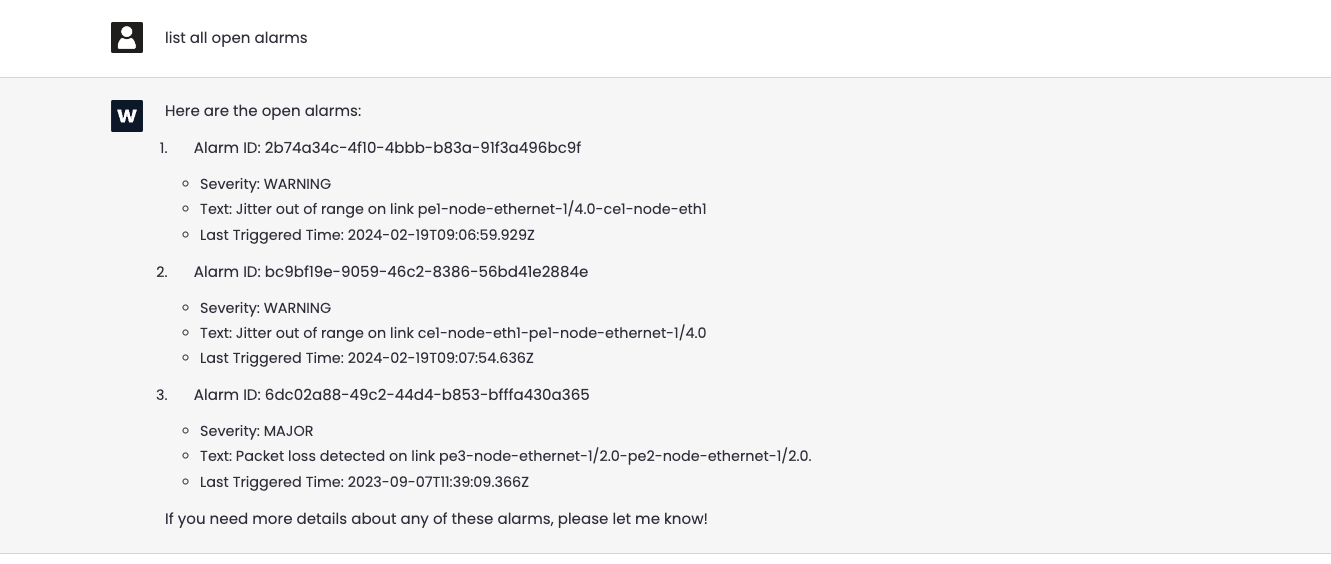
At this point this might seem fairly routine, but what makes it intriguing is the alternative perspective it offers for querying specific objects or relationships without a need to access any additional tool. Moreover, the NOC engineer is free to ask their questions in any language, which is a bonus capability made available through the use of an LLM.
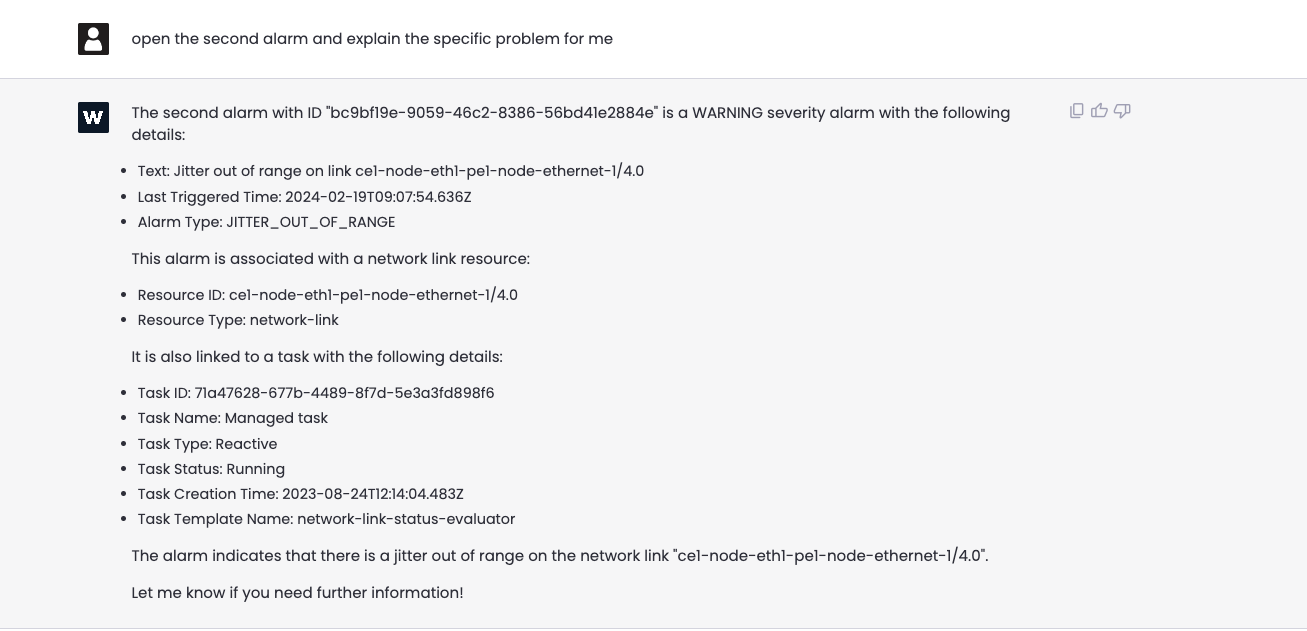
The engineer would appreciate a comprehensive detail of the data behind the second alarm: “Could you open the second alarm and explain the specific problem to me?” Focusing on these details, we observe that the alarm trigger was related to jitter being out of range, which concurs with the conclusion obtained in the previous section.
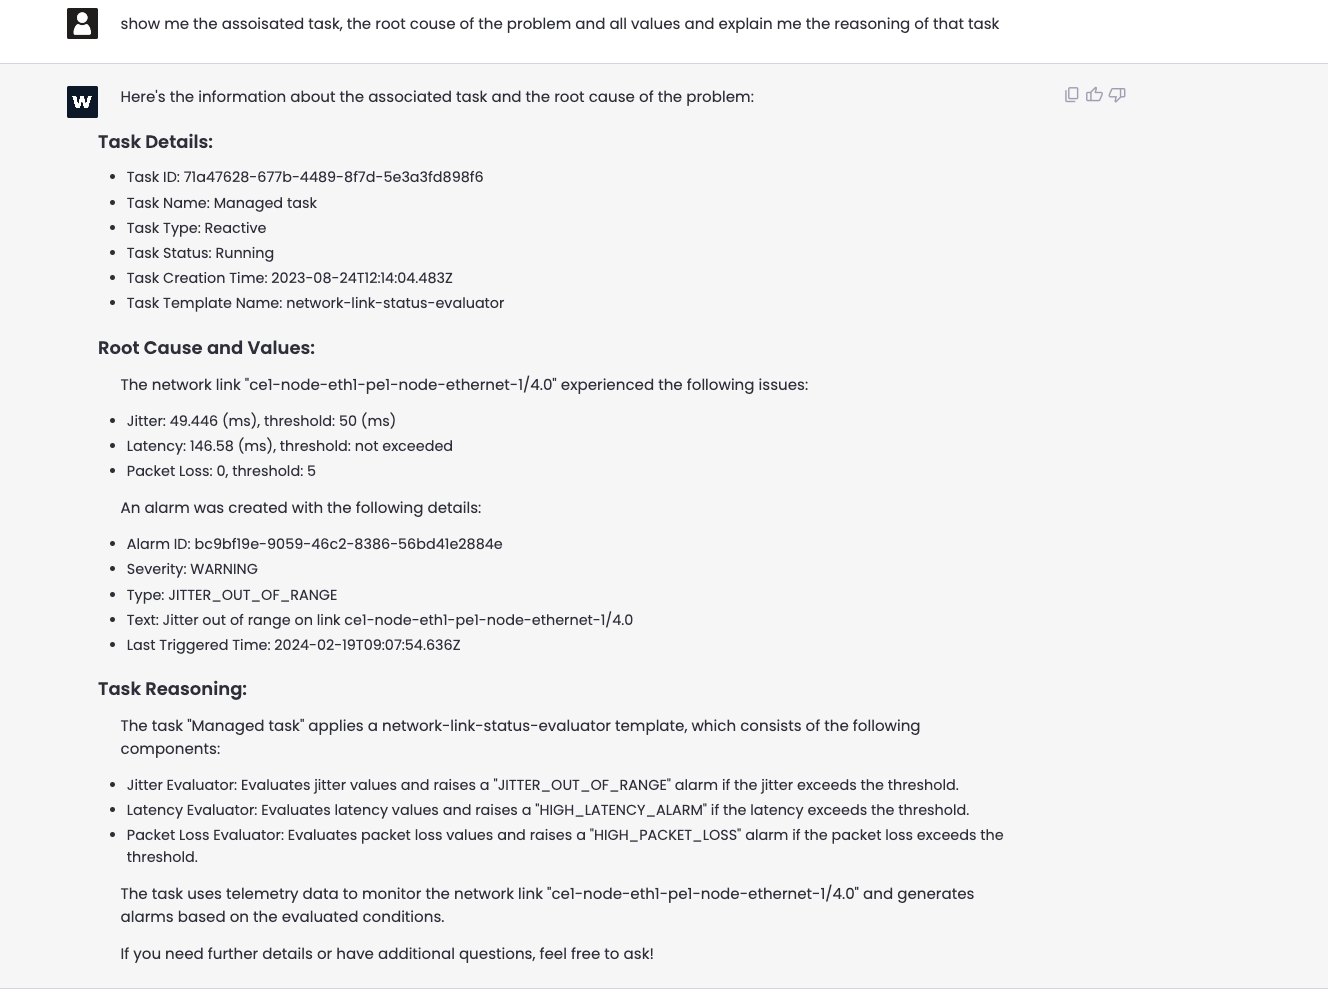
Now, it is time to look into the insights coming from the task execution: “Show me the associated task, the root cause of the problem, all associated values and the reasoning behind the alarm.”
Conclusion
As illustrated for the case of network service monitoring, the novel approach that blends the observability features of the Waylay platform with the synthesis capabilities of GenAI eliminates the need for extensive clicking through different tools and screens, providing a comprehensive explanation in a streamlined manner.
Notably, the explanation is built gradually, allowing the user to guide the reasoning process via subsequent questions that enhance precision and prompt the assistant to enrich its answers with custom information, inventory details, object relations, manuals, and other relevant parameters. To conclude, this method allows for the creation of a holistic troubleshooting framework and case management using a simple yet powerful interface.


'%3e%3cg id='Final-Copy-2_2_' transform='translate(1275.000000, 200.000000)'%3e%3cpath class='st0' d='M7.4,12.8h6.8l3.1-11.6H7.4C4.2,1.2,1.6,3.8,1.6,7S4.2,12.8,7.4,12.8z'/%3e%3c/g%3e%3c/g%3e%3c/g%3e%3cg id='final---dec.11-2020'%3e%3cg id='_x30_208-our-toggle' transform='translate(-1275.000000, -200.000000)'%3e%3cg id='Final-Copy-2' transform='translate(1275.000000, 200.000000)'%3e%3cpath class='st1' d='M22.6,0H7.4c-3.9,0-7,3.1-7,7s3.1,7,7,7h15.2c3.9,0,7-3.1,7-7S26.4,0,22.6,0z M1.6,7c0-3.2,2.6-5.8,5.8-5.8 h9.9l-3.1,11.6H7.4C4.2,12.8,1.6,10.2,1.6,7z'/%3e%3cpath id='x' class='st2' d='M24.6,4c0.2,0.2,0.2,0.6,0,0.8l0,0L22.5,7l2.2,2.2c0.2,0.2,0.2,0.6,0,0.8c-0.2,0.2-0.6,0.2-0.8,0 l0,0l-2.2-2.2L19.5,10c-0.2,0.2-0.6,0.2-0.8,0c-0.2-0.2-0.2-0.6,0-0.8l0,0L20.8,7l-2.2-2.2c-0.2-0.2-0.2-0.6,0-0.8 c0.2-0.2,0.6-0.2,0.8,0l0,0l2.2,2.2L23.8,4C24,3.8,24.4,3.8,24.6,4z'/%3e%3cpath id='y' class='st3' d='M12.7,4.1c0.2,0.2,0.3,0.6,0.1,0.8l0,0L8.6,9.8C8.5,9.9,8.4,10,8.3,10c-0.2,0.1-0.5,0.1-0.7-0.1l0,0 L5.4,7.7c-0.2-0.2-0.2-0.6,0-0.8c0.2-0.2,0.6-0.2,0.8,0l0,0L8,8.6l3.8-4.5C12,3.9,12.4,3.9,12.7,4.1z'/%3e%3c/g%3e%3c/g%3e%3c/g%3e%3c/g%3e%3c/svg%3e) Privacy Choices
Privacy Choices